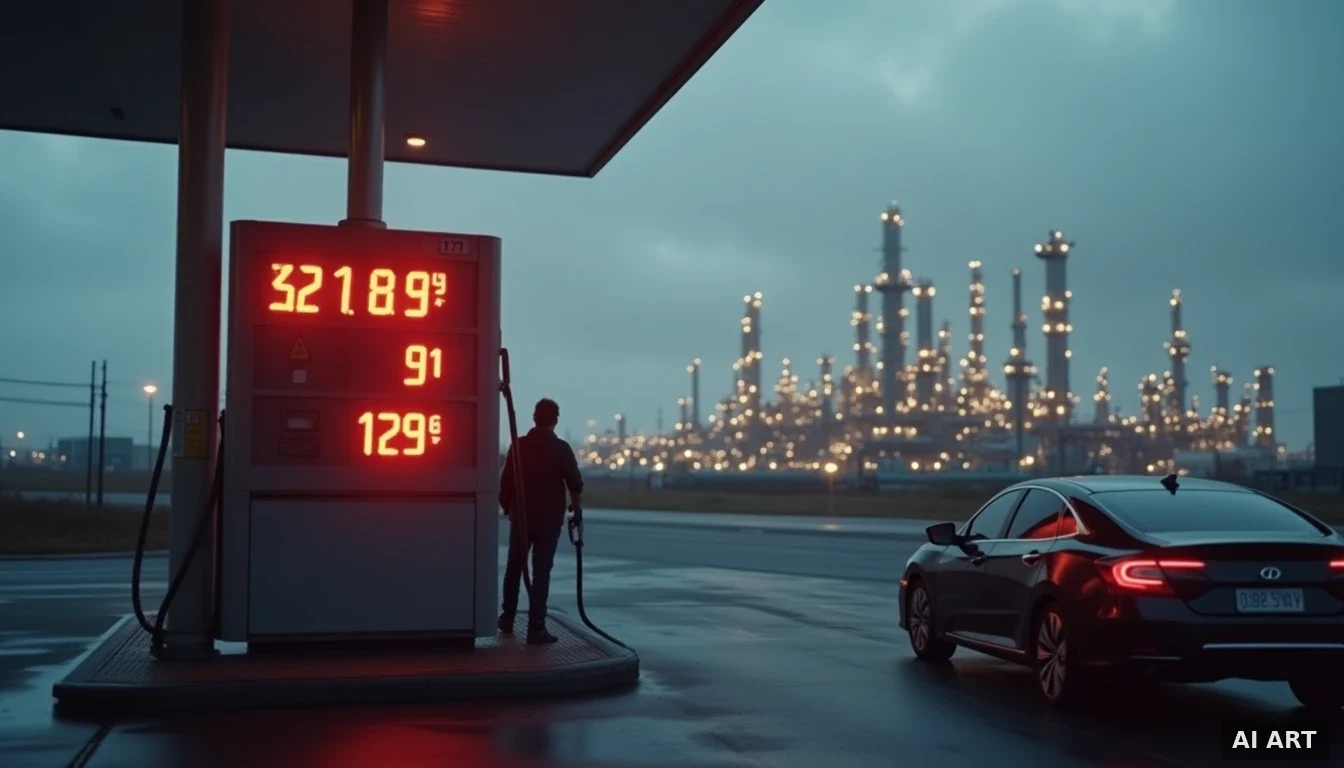
Oil Below Biden's Average — and Gas Above $4: Untangling the Rival Price Claims of 2026
Multi-perspective analysis. Each perspective deliberately argues one viewpoint; none represents the editorial position of qalarc.
A dispute over energy and food prices has flared around competing claims about how conditions under Donald Trump compare to Joe Biden's tenure. Supporters argue that oil trading below Biden-era averages during a Middle East crisis vindicates Trump's economic record, while critics point to gas above $4/gallon and rising grocery bills in 2026 as evidence the opposite is true — a debate playing out against a real US-Israel war on Iran that spiked crude prices earlier this year.
The facts (8)
- The core supportive claim is that oil falling below Biden administration averages during a major crisis reflects Trump's economic success; critics counter that everyday prices are higher now than under Biden.
- As of late June 2026, Brent crude traded around $73.74-$79.25/barrel — roughly $5-7 higher than one year prior, according to Fortune's price tracking [2].
- US crude closed below $80/barrel around Biden's last full trading day (Jan 17, 2025) and Trump's inauguration (Jan 20, 2025); a viral Trump chart depicting oil at '$120 under Biden' and '$90 under Trump' was fact-checked by CNN in May 2026 as 'wildly deceptive' [1].
- The US and Israel launched military action against Iran on Feb 28, 2026, driving oil up roughly 50% and briefly past $110/barrel in early April 2026 [4].
- The US national average gas price crossed $4/gallon on March 31, 2026 — the first time since 2022 — a benchmark from the Biden inflation era, driven by the Iran war [3].
- A widely shared consumer complaint centers on a cafe smoothie costing $13 plus tip in 2026 versus $7 under Biden, cited as evidence that food prices 'doubled'; independent tracking shows grocery prices rose roughly 20-25% during Biden's first three years, with some items (eggs +110%) far outpacing others [6][7].
- May 2026 food prices were about 3.1% higher year-over-year, and overall CPI reached 4.2% year-over-year that month, driven substantially by energy costs tied to the Iran war [5].
- Trump's net approval on inflation hit a record low of -44 in an Economist/YouGov poll (May 1-4, 2026), worse than any point recorded under Biden [8].
Context & background
Energy and food prices have been a persistent political flashpoint since inflation surged in 2021-2022 under Biden. Grocery prices rose more than 20% over Biden's first three years [7], and claims that groceries 'doubled' have circulated since at least 2024, when fact-checkers assessed the actual food-at-home increase at around 20-25% rather than 100% [6]. In February 2026, the Trump administration joined Israel in launching war against Iran, which threatened shipping through the Strait of Hormuz and pushed oil and gasoline sharply higher through the spring [4][3]. By mid-June 2026, the US and Iran reached an initial deal to end the war and reopen the strait, after which crude prices eased back toward the high-$70s [9][2].
Still unresolved
- Whether the June 2026 US-Iran deal holds and keeps oil prices settled, or whether renewed conflict pushes crude and gas back above spring highs.
- How much of 2026's food and overall inflation is attributable to energy costs from the Iran war versus other factors.
- Which baseline the competing price comparisons use — Biden's four-year average, Trump's first term, or current 2026 levels — since each yields a different answer.
Quick answers
What happened?
A dispute over energy and food prices has flared around competing claims about how conditions under Donald Trump compare to Joe Biden's tenure.
What's the evidence?
Checked against 14 candidate sources; the strongest references include: Fact check: Trump posts wildly deceptive chart on oil prices | CNN Politics; Current price of oil as of June 26, 2026 | Fortune; Gas prices under Trump just hit a benchmark from the Biden inflation era | Fortune.
Who benefits?
Trump administration and Republican political brand — Credit for lower energy prices and economic competence narrative. Domestic oil and gas producers — Policy tailwinds and regulatory relief under energy-friendly administration.
How confident is the assessment?
The fact-finding verdict is rated false — key claims are contradicted by verification. The motive analysis is 62% confident.
Why does it matter?
Lower energy prices despite 'crisis' framing establishes precedent that Trump can manage through volatility → emboldens aggressive foreign policy (Iran pressure, Venezuela sanctions) without domestic political cost from resulting supply disruptions → escalation becomes politically cheaper.
The same story, argued three ways. Pick an angle — the facts above stay the same.
🧭 Cui bono — who benefits?
Beneficiaries
- Trump administration and Republican political brand — Credit for lower energy prices and economic competence narrative
via Oil prices falling below Biden-era averages during Trump's term creates favorable comparison for voters on cost-of-living issues, even if prices remain elevated vs. pre-2021. The framing of 'crisis conditions yet still lower than Biden' allows attribution of energy market success regardless of whether Trump policy caused the decline or inherited favorable supply conditions. - Domestic oil and gas producers — Policy tailwinds and regulatory relief under energy-friendly administration
via Trump administration historically favors expanded drilling permits, reduced environmental review, and pro-fossil-fuel rhetoric. Lower prices paradoxically help producers by reducing political pressure for alternatives while maintaining drilling profitability above marginal cost, particularly for Permian Basin operators with sub-$40 breakevens. - Anti-Biden political messaging apparatus — Retrospective delegitimization of Biden economic record
via Juxtaposing current lower oil prices with claimed food price doubling ($13 smoothie anecdote) constructs narrative that Biden presided over inflation crisis while Trump delivers relief, even if absolute price levels remain elevated. Consumer price perception becomes weapon independent of CPI data.
Who loses
- Biden legacy and Democratic economic credibility—retrospective framing that high prices defined his term
- Alternative energy transition momentum—lower fossil fuel prices reduce urgency and consumer adoption incentives for EVs and renewables
- Middle Eastern oil exporters—lower prices compress revenue for OPEC+ producers already struggling with quota discipline
Ramifications (follow the chain)
- Lower energy prices despite 'crisis' framing establishes precedent that Trump can manage through volatility → emboldens aggressive foreign policy (Iran pressure, Venezuela sanctions) without domestic political cost from resulting supply disruptions → escalation becomes politically cheaper.
- If food prices actually doubled (claimed $13 smoothie) while oil fell, creates split narrative: energy competence vs. food inflation → administration can claim energy success while blaming food prices on external factors (avian flu, climate, supply chain) → selective credit-claiming becomes standard operational playbook.
- Prior research linking Trump Iran policy to $80B waste and $300B reparations liability sits in tension with current energy price success → if Iran conflict escalates and oil spikes later, current low prices become 'proof' that Trump kept lid on until Democrats/deep state sabotaged → prices become forward-deployed excuse for future foreign policy failures.
- Comparison framing (below Biden average) rather than absolute levels normalizes higher baseline → $70-80 oil becomes 'success' because Biden saw $90-100 → Overton window on acceptable energy costs shifts permanently upward → producers lock in higher long-term margins while claiming political victory for consumers.
intentional reading Republican political operation, including Trump administration messaging apparatus and aligned conservative media, is deliberately constructing 'Trump energy competence' narrative through selective comparison framing (below Biden average) while memory-holing pre-pandemic $50-60 oil baseline. Mechanism is comparison manipulation: by anchoring to Biden's worst pricing (2022 post-Ukraine invasion spike), any reversion to mean looks like Trump success. The $13 smoothie anecdote—unverified but vivid—serves as 'proof' of Biden inflation crisis to justify current elevated prices as relief. If intentional, goal is to inoculate against future economic criticism: establish energy success story now, so when tariffs or deficit spending drive inflation later, administration can point to energy sector as evidence of competence and blame other factors. The timing—early in term, during 'crisis' that somehow produces favorable prices—suggests narrative is being constructed while causation is ambiguous and Trump can claim credit before policies have time to produce negative externalities.
structural reading No coordination required: oil markets respond to global supply/demand fundamentals (OPEC cuts unwinding, demand weakness in China, SPR releases working through system), while political actors across spectrum opportunistically claim credit or assign blame based on partisan advantage. Trump benefits from mean reversion after 2022 spike regardless of policy; Republicans benefit from attacking Biden retrospectively because inflation was salient pain point for voters 2021-2023; conservative media amplifies because audience rewards Biden criticism; mainstream outlet covers because comparison is newsworthy. The 'crisis yet low prices' framing reflects genuine geopolitical tension (Iran, Russia, Venezuela disruptions) coexisting with oversupply from US shale boom that neither administration controlled. Food price claims (doubling, $13 smoothie) may reflect cherry-picked examples or regional outliers but spread because they confirm voter priors about cost-of-living pain. Structural dynamic: whoever holds office when prices fall gets credit, whoever held office when they rose gets blame, regardless of policy causation—pure political luck meeting motivated reasoning.
🎯 This narrative's market calls
Tickers the crowd narrative pointed at when this article was written — scored honestly against the price at publish. narrative confidence 75%
▲ LONG — the winners
CL▲Crude OilLower prices favor buyers; domestic production policy support expectedXOM▲ExxonMobilEnergy-friendly regulatory environment under Trump administration benefits major producersCVX▲ChevronFossil fuel policy tailwinds and reduced regulatory burdenCOP▲ConocoPhillipsDomestic oil producer benefits from pro-drilling policy stance▼ SHORT — the losers
TSLA▼TeslaLow oil prices reduce EV adoption urgency and incentivesFSLR▼First SolarCheaper fossil fuels slow renewable energy transition momentumTAN▼Invesco Solar ETFLower oil prices hurt clean energy competitiveness broadlyICLN▼iShares Global Clean EnergyReduced urgency for alternative energy amid cheap oilFrom the threads
The posts that drew the most replies in the source discussion — shown as posted. Reactions ranged across the spectrum; these are the ones people actually engaged with.
I just went to my local cafe to buy a smoothie and it was $13 plus tip. Under Biden it was $7. What went so wrong?
Why is everything so much more expensive under Trump than when Biden was president?
In the middle of the biggest oil "crisis" since the 80s. Based Trump wins again.
Continue the discussion
Add your own take — replies are kept on this article and can be upvoted.
🔗 Related Analysis
- Obama's Iran deal credibility debate shared: oil, trump
- Anti-Trump partisan attack shared: trump
- Iran military gains assertion shared: trump
- Trump military operation duration criticism shared: trump
- Criticism of perceived ignorance about Iran among a demographic group shared: trump
- Trump administration criticized for Iran war and $300 billion settlement shared: trump
References
- [1] Fact check: Trump posts wildly deceptive chart on oil prices | CNN Politics
- [2] Current price of oil as of June 26, 2026 | Fortune
- [3] Gas prices under Trump just hit a benchmark from the Biden inflation era | Fortune
- [4] Why Gas Prices Rise Under Trump And Biden | Forbes
- [5] Food Price Outlook - Summary Findings | USDA Economic Research Service
- [6] Assessing Claims That Grocery Prices Have Doubled Since Joe Biden Took Office | The Dispatch
- [7] Is price of groceries up 20% since Joe Biden became president? | Wisconsin Watch
- [8] Trump's Approval on Inflation Now Worse Than Biden's Ever Was | Cato
- [9] U.S. and Iran reach initial deal to end war, reopen Strait of Hormuz | NPR
Discussion
Select any text in the article to comment on that passage.